- Land grabbing
-
Land Policies
- For a new agricultural land policy in France
- Land Policies and Agrarian History in Europe
- The agricultural land policies of France in the 20th century
- Land issues in West Africa. Briefing notes.
- Agrarian Reforms in the World
- Lessons Learned from Niger’s Rural Code
- Land Policies and Agrarian Reform. Proposal Paper.
- Forest
- Water
- Local Land Management
- WFAL - World Forum on Access to Land 2016
- Other International Conferences and Forums
- AGTER’s Thematic Meetings - Videos
- Interviews with some members of AGTER
- Training - Education
- Education - Study trips
- Education - Training modules
- Editorials - Newsletter AGTER
- Protect the environment and ecological balances
- Develop participation in national and local decision making
- Respect basic human rights. Fight against inequality
- Establish effective global governance. Build peace
- Ensure efficiency of agricultural production and end hunger
- Develop and maintain cultural diversity
- Consider the needs of future generations. Good management of the commons
Title, subtitle, authors. Research in www.agter.org and in www.agter.asso.fr
Full text search with Google
Non-cultivated Arable Land in the World
A Memo prepared for the Food and Agriculture Commission of Coordination Sud (C2A)
Written by: Michel Merlet
Writing date:
Organizations: Association pour contribuer à l’Amélioration de la Gouvernance de la Terre, de l’Eau et des Ressources naturelles (AGTER), Coordination nationale des ONG françaises de solidarité internationale (Coordination Sud)
Type of document: Paper / Document for wide distribution
Summary
With at least 1.5 billion people suffering from hunger around the world today [cf. Annex 2 of the 2012 FAO report ‘The State of Food Insecurity in the World’ and F Dévé 2013, www.agter.asso.fr/article932_en.html], many people think that we will have to cultivate more land so that the food supply can meet the needs of humanity. It is claimed that the existence of huge surfaces of ‘under-used’ land could make it possible to respond to this challenge if large-scale investments in the agricultural sector were to be established, and this without presuming the production structures best suited for maximum production on that land. In many countries, big companies have taken control of millions of hectares in recent years, at a rate much faster than that of the expansion of cultivated land over the previous decades. While such phenomena have stirred up much local resistance and growing concern, they have not given rise to big conflicts for now. This seems to come from the fact that the areas concerned are often covered by forest or savannah with very low population density, or are former farmlands in fallow.
Yet, putting this land under cultivation can sometimes pose major environmental problems (such as acceleration of climate change and destruction of biodiversity), violate the rights of indigenous populations, and/or be accompanied by a growth in inequalities and unemployment. In the long term, these can help endanger the survival of humanity. For all these reasons, evaluating the surface area of arable land that is not cultivated at present is a central topic in discussions on land grabbing. This leads to much controversy, often accompanied by confusion and lack of comprehension, as well as to information distortion of various kinds. Are these lands covered by forests, or not? Are they ‘vacant’ and ‘available’? Are they located essentially in sub-Saharan Africa and in Latin America? The objective of this document is to help the reader gain a clear understanding of the problem, based on available data, but by remaining critical on the ways to use the latter.
The current usage of land surfaces
The three main databases
There are different databases on the real and potential agricultural use of land at the global level. They are based on statistical data and/or satellite images and record either the different types of land cover or its utilisation. In 2009, Laurence Roudart, Professor at the Université Libre de Bruxelles, supervised a study that analysed the methods and results of the most important data-bases : FAOSTAT, GAEZ and SAGE/GATP. This study, upon which we have based this section of the document, allows us to understand the differences among the concepts and the methods used, and to better understand their merits and limits. 1
The FAOSTAT data are indicators of both land cover and land utilisation. They are compiled by FAO (UN Food and Agriculture Organization) based on national statistics and surveys of states. Some categories can lead to confusion, such as ‘Permanent meadows & pastures’, which may be natural or spontaneous and may or may not be utilised; ‘Forest area’, which also covers savannah woodland if the forest cover is greater than 10%; and fallow land utilised in the process of crop rotation and for which the definition is not very precise.
The GAEZ system (IIASA – International Institute for Applied Systems Analysis and FAO) gives information on agricultural production potential, based on the land’s suitability for the cultivation of 154 plant varieties, as well as accessible yields according to three theoretical management methods – ‘advanced’, ‘improved’ and ‘traditional’ – in rainfed and irrigated agriculture.
This analysis is based essentially on agronomic and ecological criteria. It does not truly take into account socio-economic parameters. It compares the needs of the plants studied with the climatic, soil and altitude conditions over grid-cells of 5 minutes latitude/longitude (10 km on each side at the equator).
For each crop and each management method, these zones are put into different categories of crop suitability in relation to the best observed yield in the major corresponding climatic zone. A summary is then made by combining the three management methods and the 154 varieties considered. The GAEZ system specifies which land surfaces are currently forest-covered for the different categories of arable lands. It does not consider the evolutions that may be either negative (e.g. soil degradation or drop in groundwater, etc.) or positive (e.g. development, draining, organic or mineral additions, etc.). Some of its methodological choices tend to overestimate the extent of arable land, whereas others on the contrary underestimate it.
The SAGE (Center for Sustainability and the Global Environment) / GATP (Global Trade Analysis Project) database combines the FAOSTAT data with information on land cover from satellites. Without going into the details of the methodology used, let us point out that SAGE works based neither on the theoretical needs of plants nor on attainable yields, but based on land characteristics and on whether the land is really used for cultivation. It does not take into account economic or social factors, or evolutions underway, any more than the GAEZ system does.
The role of forests, savannahs and cultivated areas
Based on the definitions used by SAGE/GTAP, L. Roudart presents the different types of land surfaces 2. The categories ‘Croplands’ (all arable land and land cultivated with permanent crops) and ‘Permanent meadows & pastures’ are those of FAO.
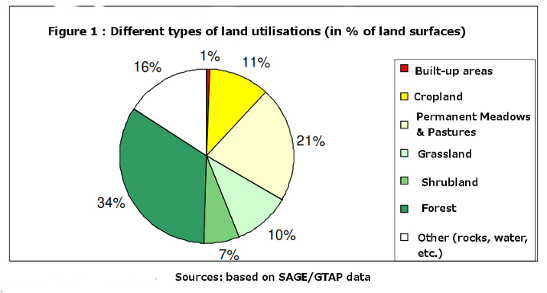
One-third of land surfaces is covered by forests, and about another third is used for agricultural or pastoral uses (some permanent meadows and pastures are not grazed, and some grasslands and shrublands could be). Built-up areas occupy only a small percentage of land surface. Estimations of cultivated land surfaces differ between SAGE and FAO. SAGE gives 1,805 million ha in 1992; this is 17% more than FAO, which announced 1,525 million ha. Cereals occupy 55% of these surfaces, oleaginous plants 15%, dry legumes 5%, root and tuber crops 4%, sugar crops 2% and other crops 19%. 3. FAO and SAGE permanent meadow estimations are similar (3% more for FAO), but behind this overall similarity in figures lie diverging estimations for the different continents that average out at the global level.
Overall data for arable land and cultivated land
The GAEZ system and the SAGE/GTAP database provide in-formation on the surface areas of arable land by using data from the 1990s as references for their models.
For the GAEZ system, the surface area of land suitable for rainfed cultivation of at least one of the 154 plants used, whatever the management method, represents 27% of land surfaces, or 3,573 million ha for very suitable, suitable and moderately suitable land for cultivation and 4,152 million if land considered marginally suitable is included.
Nearly one-fourth of land suitable for cultivation is currently covered by forests, representing one-third of the world’s forestland 4. The regions for which more than 30% of arable land is covered by forests are South America, North America, Central Africa and Russia.
SAGE estimates arable land surface in the world at 4,022 million ha, a figure slightly lower than that of the GAEZ system. According to these two databases, the proportion of non-cultivated arable land in the world is sizeable: 62% according to GAEZ and 55% according to SAGE/GTAP 5.
L. Roudart discusses several hypotheses for extending cultivated land area: (1) considering only the most suitable land for cultivation, (2) including all land suitable for cultivation but without touching forestland, and (3) considering cultivation of all land suitable for cultivation including that covered by forests. According to these hypotheses, the cultivated land of 2005 could be multiplied by 1.7 for Hypothesis 1, by 2 for Hypothesis 2 and by 2.5 for Hypothesis 3.
The author concludes this section as follows: ‘It seems that despite the divergences, uncertainties and limits regarding the databases that we have studied, the land surfaces that can be used for rainfed cultivation and that are not yet cultivated are very extensive on a global scale and include several major regions in many countries, especially in South America and sub-Saharan Africa. On the other hand, this resource seems rare or even exhausted in the Middle East and in Asia given the methods used to charge the suitability of land for cultivation’ 6.
We shall now look at some ways in which this type of data has been used and at some questions they raise.
Figures that lend themselves to multiple interpretations
World Bank yield gaps
Chapter 3 of the study Rising Global Interest in Farmland. Can It Yield Sustainable and Equitable Benefits? published in 2011 by the World Bank examines the possibilities of developing land with unexploited or underexploited agricultural potential. With the support of IIASA, the authors conclude that, in regions where population density is less than 25 persons per km2, there seems to be 445 million ha of non-forested and unprotected land that is currently non-cultivated but capable of being cultivated in an ecologically suitable way 7. They analyse the yield gap between reality and potential from a commodity perspective by studying five crops that have an important role in trade exchanges: wheat, maize, soya, sugarcane and oil palm. The report presents a typology of the countries concerned by comparing land ‘availability’ and the yield gaps observed for the production of these five crops. This is done in order to explore how private investment in agriculture can improve productivity and become the central pillar of a pro-poor development strategy 8.
No agronomic or sociological element is included in the analysis, as in the previous studies of IIASA. The parameter studied (gross yield per hectare of single crop) is not really relevant, because it does not take into account the wealth created. The value added per surface unit (= gross production - inputs used in the production process - share of equipment and infrastructures that are a part of the production) should be taken into account. Even though the report emphasises the need to respect the rights of local populations and obtain the agreement for any transfer of land rights to big companies, it uses a method that is presented as scientific but that from the beginning distorts the comparison between the family production units and agribusiness, by not taking into account the systems of family farm production as a whole and by ignoring the cost of inputs and machines for large-scale production.
What we find by zooming in on non-cultivated arable areas
G. Chouquer and other researchers have shown that analysis of satellite images without verification in the field or analysis at a more local scale have often led to mistaken interpretations. By zooming in on an area that seems empty, we can discover fields and the various land-use forms that show that people live there 9.
Dissociating forest and pasture areas from croplands based on aerial images leads to misunderstanding of what often represents the key to the sustainability of farming systems: the complementary nature of their usage. In slash-and-burn systems, forest regrowth is an integral part of cultivated spaces. Horizontal fertility transfers created by herds grazing over their routes make permanent cultivation of fields possible by maintaining or increasing soil fertility. To this complementarity of an agronomic nature can be added the socio-land characteristics of farming systems, which play a decisive role in how they work.
Finally, the evolution processes of these systems are essential. Many regions are the outcome of several centuries of transformation. In some cases this has led to degradation in soil, in water reserves or in the resilience of farming systems. Other cases have seen the opposite processes of increase in fertile soil and accumulation of water. For example, the 2011 FAO report The State of the World’s Land and Water Resources for Food and Agriculture points out that one-fourth of the Earth’s land is highly degraded or undergoing a high degradation trend 10.
Very unequal distribution of potentially arable lands
The studies and reports draw attention to the high level of availability of unused lands in sub-Saharan Africa and in Latin America. But applying the previously described agroecological criteria shows a much more diversified situation. The following map was created based on data from the GAEZ system. 11
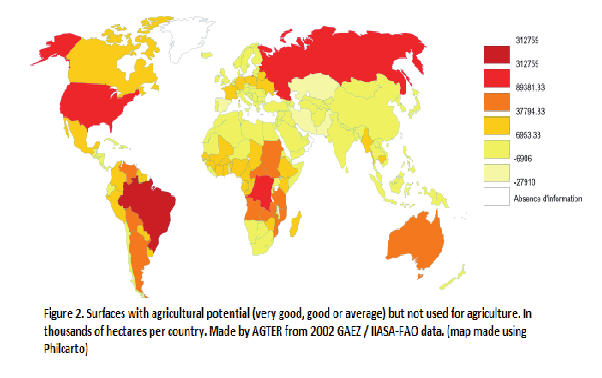
Among the countries that have the most non-cultivated arable land, we can also find the USA and Russia. In Latin America (Brazil) and in sub-Saharan Africa (DRC), such land is largely found in the major forest basins and in savannah regions. Finally, Western Europe also has non-cultivated arable land. 12
Yet, the analyses and reports generally neglect to point this out. After having introduced a certain number of restrictive criteria that are more or less clearly justified, the authors of many reports present the phenomenon of non-cultivated arable land as characteristic of developing countries, and the developed countries disappear like magic from the list of countries concerned.
The importance of socio-economic factors
Large-scale land appropriations and the phenomena of land concentration are facilitated by the existence of huge underused and hardly populated regions, but not all are likely to fall easily under the control of big national or foreign companies. It is the socio-economic factors that are decisive. Colonial heritage and the consequences of collectivisation in the ex-communist countries weigh heavily in the balances of power among the existing stakeholders. 13
Cultivating ‘underused’ lands is often misleadingly presented as contributing to food and to the production of agricultural raw materials for the well-being of humanity. But reality is quite different: A vast process of appropriating and grabbing public resources exists, but this is much more difficult to carry out in developed countries that have solid family farming with recognised land rights.
The situation described by the GAEZ and SAGE systems in no way defines a universe of available lands on which there would be no people and no rightful owners. Rather, it gives an idea of the scale of agricultural resources that can be targeted by companies seeking opportunities for high return on their ‘investments’, in all the places where there is no effective land governance system that can oppose resource-grabbing.
Population distribution and access to resources: a worldwide problem
Previous analysis has highlighted very uneven availability of arable land per inhabitant in the various regions of the world. Even though such land remains abundant in Africa and in Latin America, it is not necessarily accessible for family farmers. In places where land is very unevenly distributed, redistribution processes (agrarian reforms and land policies that can make the effects last over time) seem to be necessary in order to enable sustainable economic and social development. In many of these countries, the abundance of ‘virgin’ land has made it possible to avoid such redistribution: The development of pioneer fronts has led to continued expansion of agricultural land and the migration of landless peasants, and this has acted as a safety valve for areas where land pressure had become too strong.
The competition between large-scale production and family-farm production in these new areas has played a decisive role in setting up agrarian structures. In the last few decades, large-scale production has very much gained the upper hand thanks to new technical methods, and this has led to the current land and resource grabbing.
Today, the same phenomena are occurring at the global level. While smallholder farming colonisation policies may be encouraged within a single country – but not without conflicts and dispossession often affecting indigenous peoples – such policies are extremely difficult to organise at the international level. Currently, only land market mechanisms (purchases or concessions) work to regulate distribution of resource utilisation rights. The consequence is the development of very big companies that prosper based on the appropriation of natural resources and public goods.
The great inequality in agricultural land per inhabitant in various regions of the world is a fundamental problem on a global scale. The national level will not suffice for optimising the utilisation of resources, all the more so because maximisation of production cannot be the sole criterion for choosing. Indeed, it is also obviously important to consider the overall environmental requirements and to reduce family-farm evictions and the risks of conflict, etc.
Faced with this fundamental issue of world governance, we will have to invent new mechanisms to prevent the contradictions generated by such inequalities from turning into open conflicts.
Translation to English: Eric Alsruhe
1Here we take up only the elements of analysis that are most relevant to the subject we are concerned with. The reader can consult the four documents listed in the bibliography for more in-depth analyses.
2cf Graph. 1, Roudart 2009, p.16
3SAGE, cited by L. Roudart. Op cit p.18
4Roudart, 2009, p 20
5Roudart 2009, p.26
6Roudart 2009 p 30
7Deininger 2011 p. 77
8Deininger 2011 p 83
9Chouquer, 2012, p 91-93
10FAO, SOLAW, 2011 p.113
11Merlet et al, 2011, p.9
12Much of the forestland of developed countries, which is used for commercial production of several types of wood, is established on land that was once cultivated
13Merlet et al, 2011
Bibliography
-
Roudart, L. (2009). Terres cultivables et terres cultivées : apports de l’analyse croisée de trois bases de données à l’échelle mondiale. Document produced for the Statistics and Outlook Service of the French Ministry of Food, Agriculture and Fisheries. 59 p.
-
Roudart, L. (2010). Terres cultivables non cultivées : des disponibilités suffisantes pour la sécurité alimentaire durable de l’humanité. French Ministry of Food, Agriculture and Fisheries, Studies and Outlooks Centre. Revue Analyse N° 18 - May 2010. 8 p.
-
Deininger, K. and Derek B. (2011). World Bank. Rising Global Interest in Farmland: Can It Yield Sustainable and Equitable Benefits? 214 p.
-
Toulmin, C. et al. (2011). HLPE Committee on World Food Security. Land Tenure and International Investments in Agriculture. 56 p.
-
Merlet, M.; Jamart, C.; L’Orphelin S.; Groppo P. (2011) Points chauds liés au foncier et aux droits sur l’eau. SOLAW Background Thematic Report TR05a. FAO. 34 p.
-
FAO. SOLAW. (2011) The State of the World’s Land and Water Resources for Food and Agriculture - Managing Systems at Risk. Food and Agriculture Organization of the United Nations. 285 p.
-
Chouquer, Gérard. (2012), Terres porteuses. Entre faim de terres et appétit d’espace. Ed. Actes Sud, Errance Paris. 247 p.
Download the document
Folder
Resource
Challenge
See also
Translations
- Las tierras cultivables no cultivadas en el mundo
- Les terres cultivables non cultivées dans le monde
Organizations


 Agter is part of the Coredem